Lab
1
1.
Show
the appropriate software output of the summary statistics including
missingness, min, max, mean, and standard deviation for all the numerical
variables and number of levels for all the categorical variables.
(Kindly refer to the attached file)
2.
How
does the weekly sales compare between these stores? Specifically, which store has the highest weekly sale
value overall, which has the highest median weekly sales, and which has the
highest average weekly sales? Provide a box graph and a brief discussion
to explain the graph. Remember to include your first and last name in the
footnote of your graph.
The plot box
graph was used to compare the weekly sales between the 45 stores of Walmart
which can be used to predict the sales.
Based on the results, store 14 recorded the highest weekly sale value
when compared to the weekly performances among the 45 stores. Similarly, the
blot box graph also shows that store 20 recorded the highest median weekly
sales when compared to the weekly performances by the 45 stores. The results
also shows that store 24 managed to record the highest average weekly sales
when compared to the average performance among the 45 stores of Walmart from
5/2/2010 to 1/11/2012.

3.
How
does the weekly sales compare for the different weeks of the year?
Specifically, which week has the highest weekly sale value overall, the highest
median weekly sales, and the highest average weekly sales. Provide a box graph
and a brief discussion to explain the graph. Remember to include your first and
last name in the footnote of your graph.
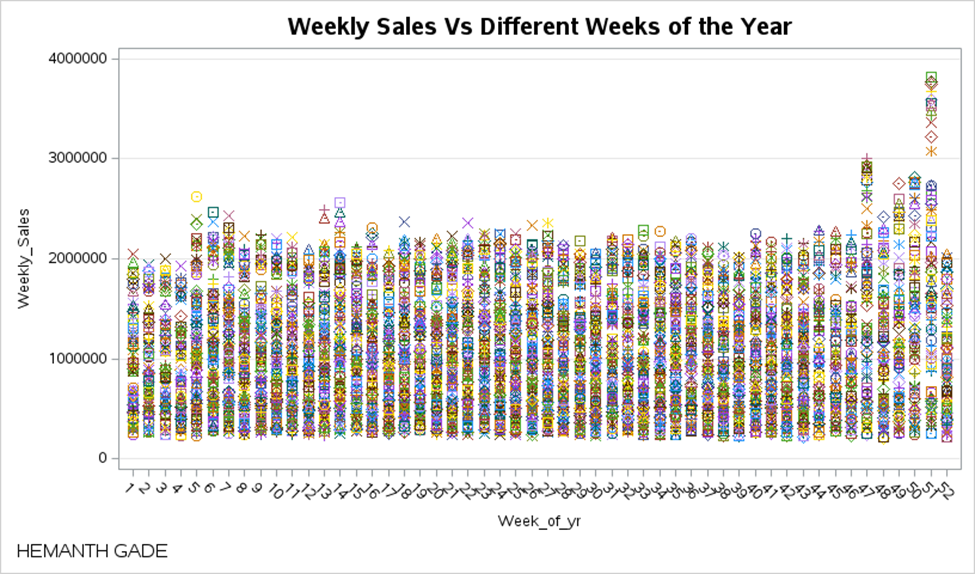
The box graph
was used to show the historical performance of the weekly sales in different
weeks of the year for the 45 stores of Walmart. The results show that the
highest weekly sale value was recorded during in the 52 week when compared to
the performance during the other weeks. Similarly, the highest median weekly
sales was recorded during week 51 during a holiday like Christmas holidays when
compared to the performance during the other weeks. The highest average weekly
sales were recorded during week 14 as shown by the box graph.
4.
Make
some comments on distribution of the weekly sales? What about its center and
variability? Is it symmetric, right-, or left- skewed? Provide a histogram and
descriptive statistics to support your claim. Remember to include your first
and last name in the footnote of your graph.
The distribution
of weekly of the weekly sales shows that the data is symmetric the spread of a
data set. Moreover, the center of distribution divides the distribution so that
approximately half the observations take smaller values, and approximately half
the observations take larger values. As shown below


No comments:
Post a Comment