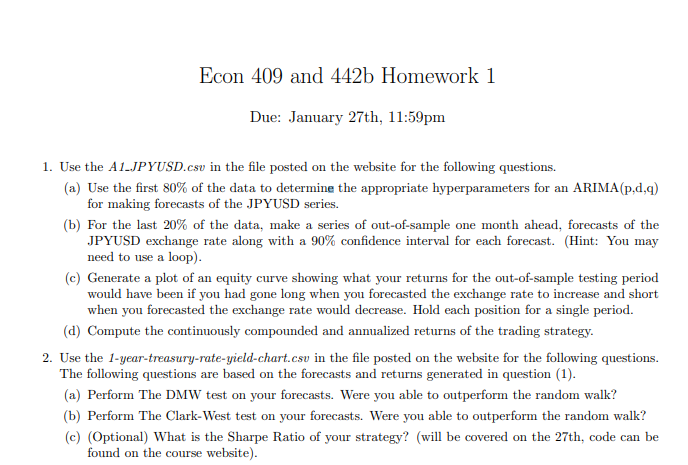
1. Use the A1 JPYUSD.csv in the file posted on the website
for the following questions.
(a) Using the first 80% of the data to determine the
appropriate hyperparameters for an ARIMA(p,d,q) for making forecasts of the
JPYUSD series.
(b) For the last 20%
of the data, make a series of out-of-sample one month ahead, forecasts of the
JPYUSD exchange rate along with a 90% confidence interval for each forecast.
(Hint: You may need to use a loop).
(c) Generate a plot of an equity curve showing what your
returns for the out-of-sample testing period would have been if you had gone
long when you forecasted the exchange rate to increase and short when you
forecasted the exchange rate would decrease. Hold each position for a single
period. (
d) Compute the continuously compounded and annualized
returns of the trading strategy.
2. Use the 1-year-treasury-rate-yield-chart.csv in the file
posted on the website for the following questions. The following questions are
based on the forecasts and returns generated in question (1).
(a) Perform The DMW test on your forecasts. Were you able to
outperform the random walk?
(b) Perform The Clark-West test on your forecasts. Were you
able to outperform the random walk?
(c) (Optional) What is the Sharpe Ratio of your strategy?
(will be covered on the 27th, code can be found on the course website).


No comments:
Post a Comment